Over midterm we all went to Carrick-on-Shannon in Leitrim for a holiday! While this was a fun outing, we also used the time to gather some more data. We surveyed some people that we met on the street, so that we could see if the geographic seperation had much (if any) of an effect on their racial beliefs.
We only got to interview around 20 people in Carrick-on-Shannon, but we managed to get a fair bit of interesting data out of it;
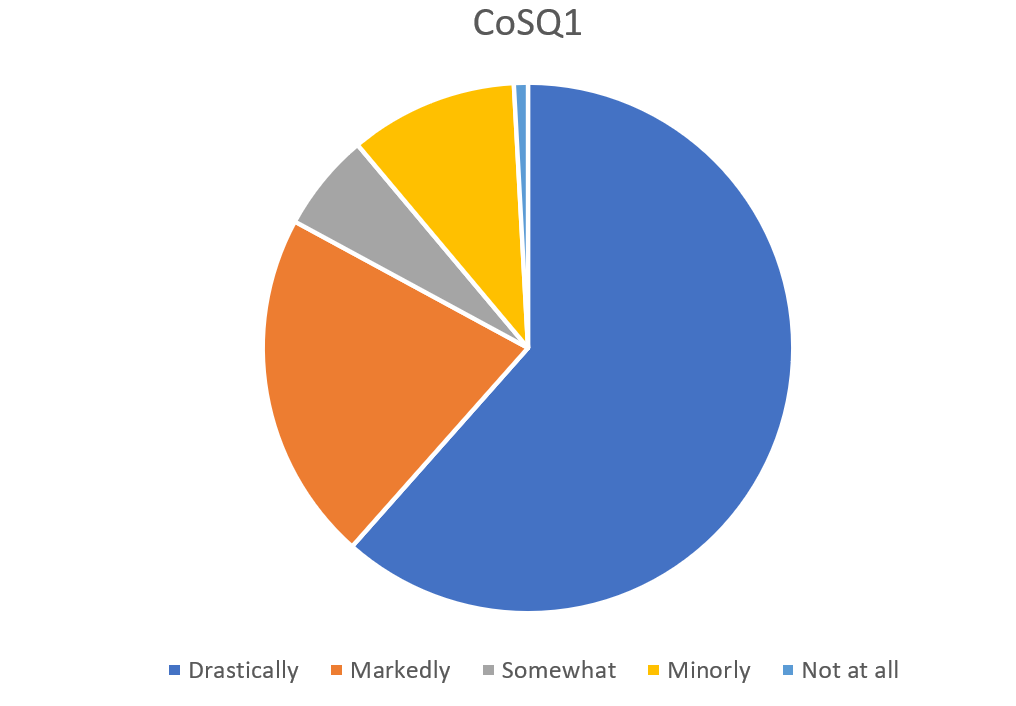
As we can see, people in Leitrim seem to have had quite a large change in opinions over the last few years, more so than in Dublin.
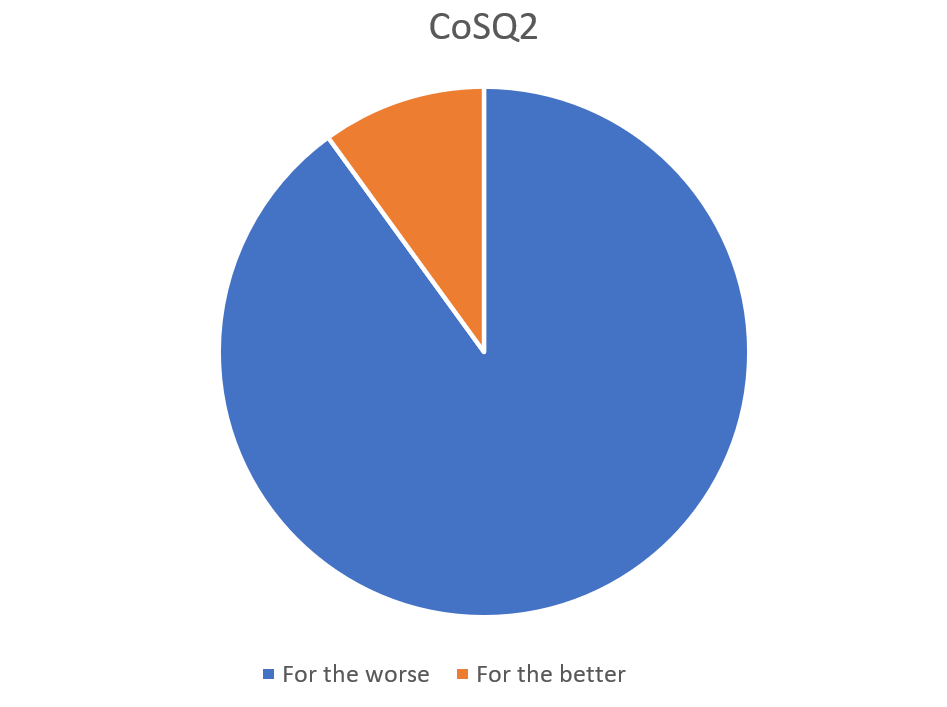
And, in common with Dublin but with its severity more accentuated, people think that race relations have deteriorated since 2019/20;
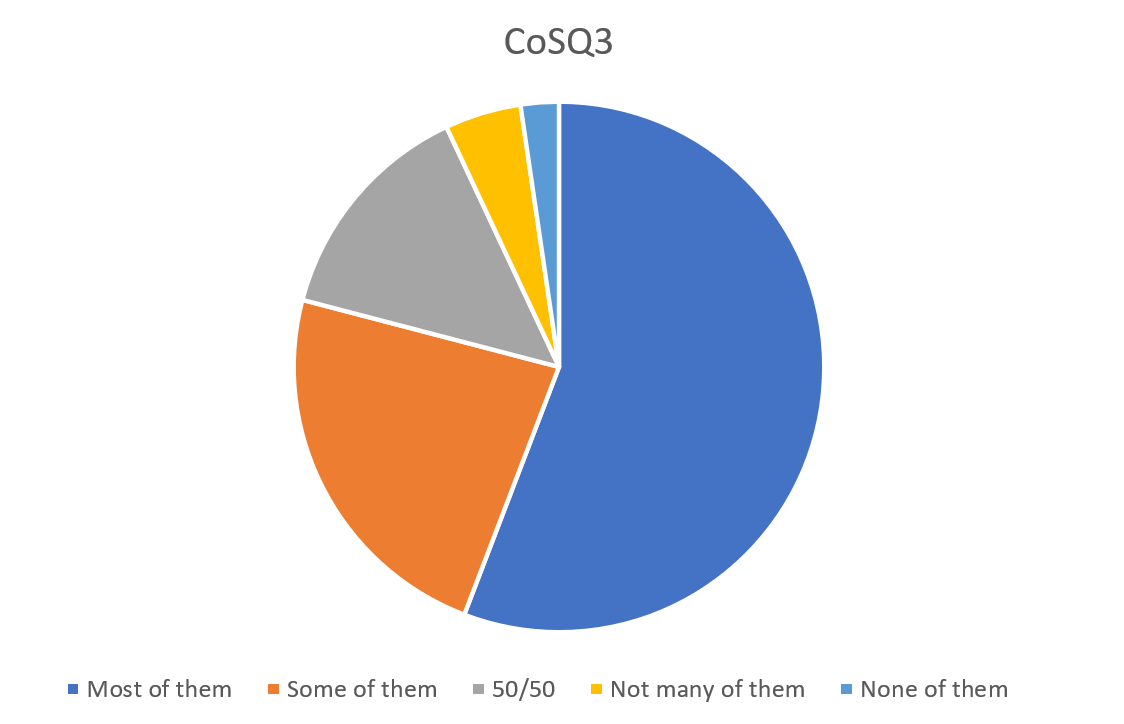
A slim majority of people also seem to have friends who mostly agree with them, while in Dublin it tended to be more 50/50. I would say that this is because there's more people in Dublin, one is more likely to know a more diverse group of people, and therefore encounter a more diverse range of opinions.
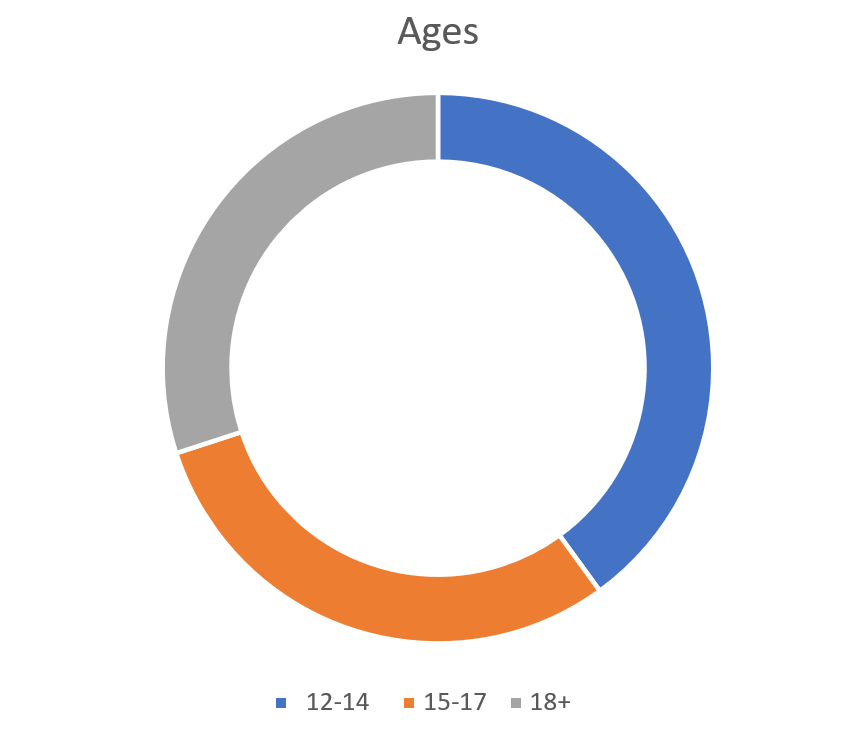
The ages of those that we surveyed stayed basically the same between the two cities, but Dublin had a slightly bigger proporion of people over 18.
Ages of the people in Dublin that we interviewed
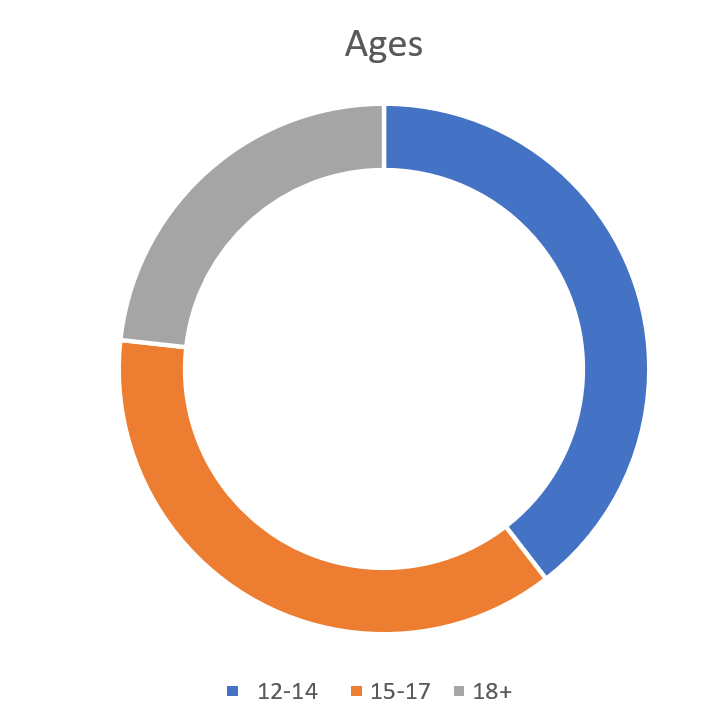
As you can see, Carrick was skewed slightly younger, I would reason because many people move to Dublin or even abroad once they come of age to find employment.
Carrick also had far more women than men it seemed, compared to Dublin which seemed to be mostly men.
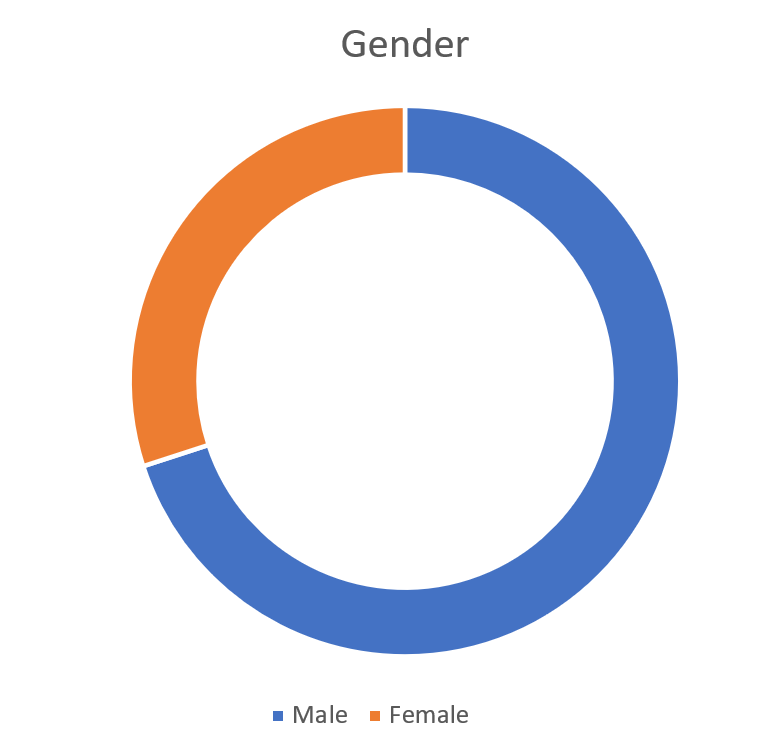
Dublin
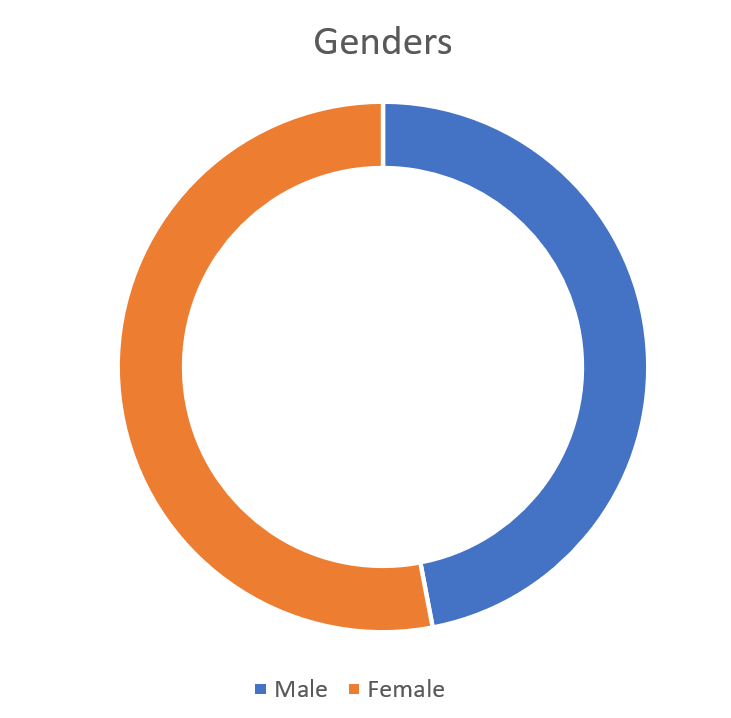
Carrick-on-Shannon
If you refer to the previous post, we actually included a "prefer not to say" option when we asked about gender (at the behest of our teacher), but in the end no-one opted to choose this option, so it was left out of the infographics